Common features in ASP.NET Core 2.2 WebApi: Profiling
- Common features in ASP.NET Core 2.1 WebApi: Authenticating with a JWT
- Common features in ASP.NET Core 2.1 WebApi: Validation
- Common features in ASP.NET Core 2.1 WebApi: Error handling
- Common features in ASP.NET Core 2.1 WebApi: Logging
- Common features in ASP.NET Core 2.1 WebApi: Testing
- Common features in ASP.NET Core 2.1 WebApi: Documenting
- Common features in ASP.NET Core 2.2 WebApi: Profiling
- Common features in ASP.NET Core 2.2 WebApi: Caching
- Common features in ASP.NET Core 2.2 WebApi: Mapping
Introduction
It is quite natural to wonder about the performance of a newly developed Web API.
There are for example tools like Application Insights in Visual Studio and Azure which allow to monitor your applications, There is another Stackify Prefix tool which is free and which allows to trace Http requests. This tool is described here: https://www.carlrippon.com/scalable-and-performant-asp-net-core-web-apis-profiling-and-monitoring/
In this article we will explore the integration of MiniProfiler into an ASP.NET Core 2.2 Web API, a free tool that allows you to finely profile any code protion in ASP.NET and ASP.NET Core applications.
Bonus! We will also see how MiniProfiler can be easily integrated to Swagger!
Installation
Download this package:
PM> Install-Package MiniProfiler.AspNetCore.Mvc
Configuring Startup.cs
It’s pretty simple to configure and activate MiniProfiler.
First let’s add MiniProfiler in ConfigureServices method:
public void ConfigureServices(IServiceCollection services)
{
   // profiling
   services.AddMiniProfiler(options =>
      options.RouteBasePath = "/profiler"
   );
}
Now let’s activate the middleware that enable MiniProfiler:
public void Configure(IApplicationBuilder app, IHostingEnvironment env, ILoggerFactory loggerFactory)
{
   // profiling, url to see last profile check: http://localhost:xxxxx/profiler/results
   app.UseMiniProfiler();
}
Setup your portion of code you want to profile
public class DemoProfilingController : ControllerBase
{
   // GET: api/DemoProfiling
   // url to see last profile check: http://localhost:xxxxx/profiler/results
   // profile available in swagger page too
   [HttpGet]
   public IEnumerable<string> Get()
   {
      string url1 = string.Empty;
      string url2 = string.Empty;
      using (MiniProfiler.Current.Step("Get method"))
      {
         using (MiniProfiler.Current.Step("Prepare data"))
         {
            using (MiniProfiler.Current.CustomTiming("SQL", "SELECT * FROM Config"))
            {
               // Simulate a SQL call
               Thread.Sleep(500);
               url1 = "https://google.com";
               url2 = "https://stackoverflow.com/";
            }
         }
         using (MiniProfiler.Current.Step("Use data for http call"))
         {
            using (MiniProfiler.Current.CustomTiming("HTTP", "GET " + url1))
            {
               var client = new WebClient();
               var reply = client.DownloadString(url1);
            }

            using (MiniProfiler.Current.CustomTiming("HTTP", "GET " + url2))
            {
               var client = new WebClient();
               var reply = client.DownloadString(url2);
            }
         }
      }
      return new string[] { "value1", "value2" };
   }
}
MiniProfiler.Current.Step() is the most common way to define section of code to be profiled.
This method takes in parameter a string that describes the name of the code section.
The same method can be nested with the previous indefinitely (code in bold above).
MiniProfiler.Current.CustomTiming() helps to categorize finely the portion of code profiled, like the exact command executed and in what category the profile is set for.
In our example we categorize the profiled code in “HTTP” and “SQL”.
Demo
Let’s take a look on the result after the execution of our code (http://localhost:xxxxx/api/Demoprofiling)
As we set it up in the Startup.cs let’s call the route that display profiling results:
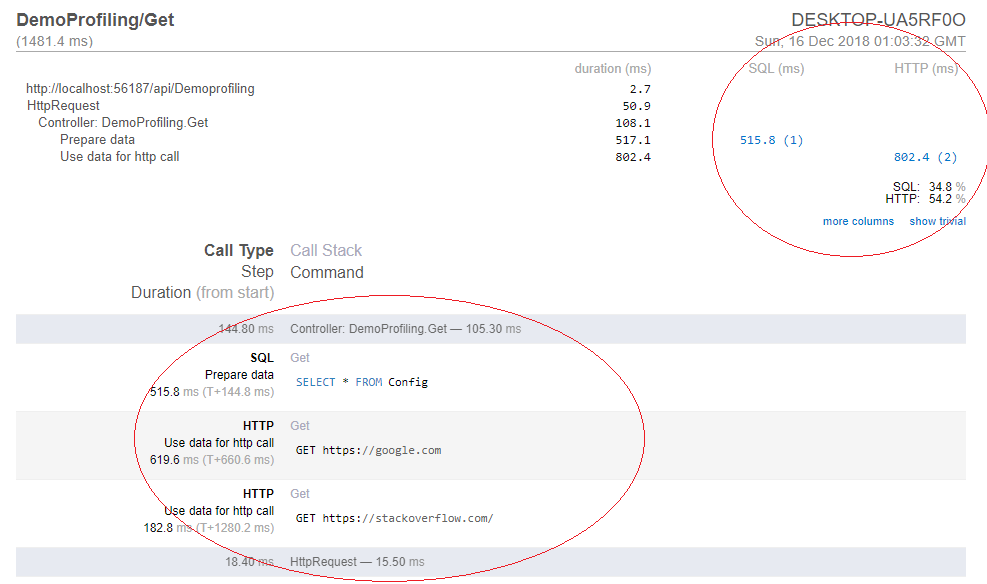
As we can see each steps appear clearly with their respective portions of code.
Each category (HTTP and SQL) have their own statistics, an easy to see which part of the application takes time and causes or not performance issues.
This page shows only the latest request.
It’s for sure possible to log into a database or in a file via a logger the statistics. (I will provide an example of implementation soon).
Bonus: Integration with Swagger
As I promised earlier here is hiw we can integrate MiniProfiler with Swagger.
In order to achieve this we have to modify the index.html page of Swagger.
Download the index page:
The default index.html is downloadable here:
Let’s setup Swagger’s custom page:
In your Startup.cs file, modify options of UseSwaggerUI middleware to add IndexStream option:
app.UseSwaggerUI(c =>
{
   c.RoutePrefix = "api-doc";
   c.SwaggerEndpoint("/swagger/v1/swagger.json", "My API V1");
   // this custom html has miniprofiler integration
   c.IndexStream = () => GetType().GetTypeInfo().Assembly.GetManifestResourceStream("WebApiDemo.SwaggerIndex.html");
});
Then name your html file as you desire, in our example: SwaggerIndex.html, WebApiDemo is the namespace where the file is located.
At the top of the file, add this script:
<script async="async" id="mini-profiler" src="/profiler/includes.min.js?v=4.0.138+gcc91adf599"
        data-version="4.0.138+gcc91adf599" data-path="/profiler/"
        data-current-id="4ec7c742-49d4-4eaf-8281-3c1e0efa748a" data-ids="" data-position="Left"
        data-authorized="true" data-max-traces="15" data-toggle-shortcut="Alt+P"
        data-trivial-milliseconds="2.0" data-ignored-duplicate-execute-types="Open,OpenAsync,Close,CloseAsync">
</script>
To make everything working don’t forget to set in the HTML file properties “Build Action” to “Embedded resource”.
Now let’s execute again the same code like previously and see the Swagger page:
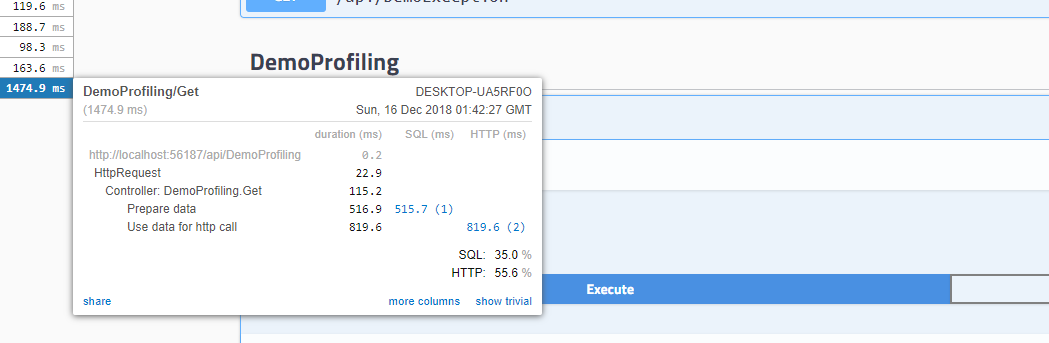
The statistics are now provided in a little box on the top left of the screen.
Awesome isn’t it ? 😉
Conclusion
Now you know how to profile your Web APIs easily. MiniProfiler is simple to implement and it’s easy to understand metrics.
If you want to monitor each request with all wanted metrics, I suggest you to store your metrics in a database and build a WebApp with the data stored.
Promise I will come back soon with a database storage implementation 🙂