
Did you know ? Easy and custom debugging with DebuggerDisplay and DebuggerTypeProxy attributes on Visual Studio
Introduction
If like me you want to become more efficient in debugging, I have here for you a great feature available in Visual Studio 2019 (also Visual Studio 2017).
This involves customizing the display of variables in debug mode with the DebuggerDisplay and DebuggerTypeProxy attributes. Note that the following languages are supported: C #, Visual Basic, F # and C ++
DebuggerDisplay attribute usage
In this first example I will show you how to display the ouput you want in in debug on a simple object.
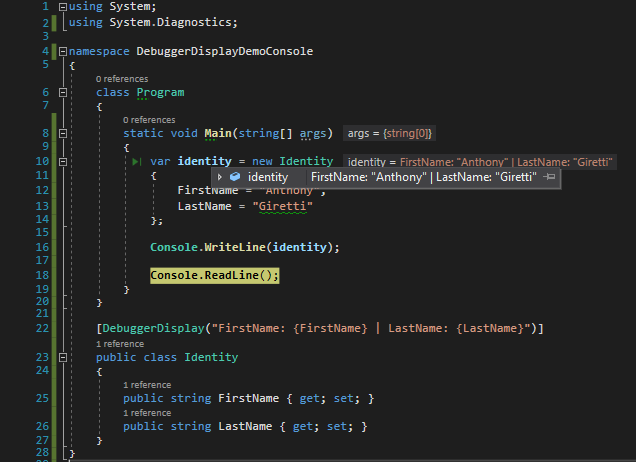
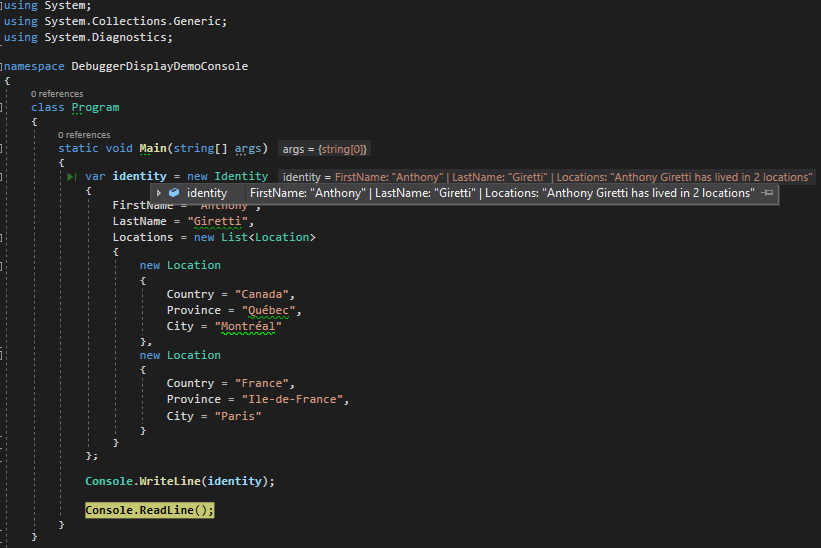
We’ll need to add DebuggerDisplay attribute on the class with for example, the custom formatting below (“FirstName: {FirstName} | LastName: {LastName}”):
On debug mode if you put the mouse on the variable name you should see the output you set just before:
Note that if you have installed ReSharper, it will display automatically the same output, pratical I think.
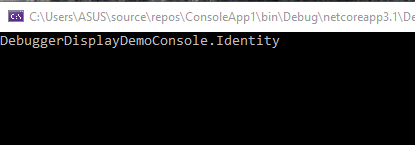
Note that if you try to use this custom display outside a debugging context (step by step debugging or Watch window) such as Console.Write() , it won’t work:
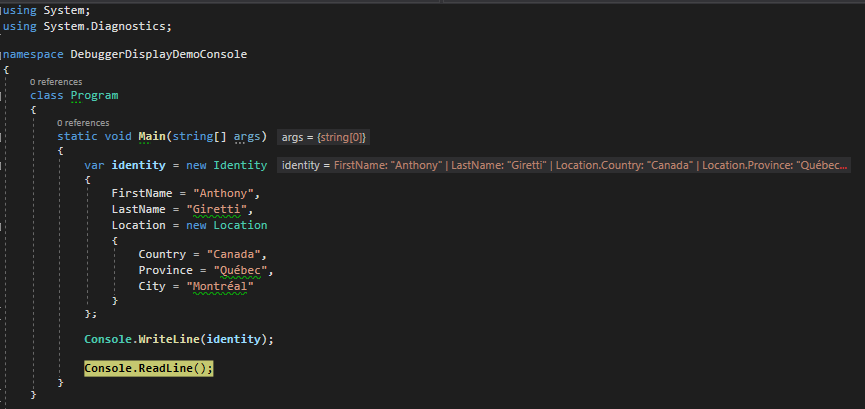
Now let’s try a more complex object, you can customize the output from the root object like this:
Or from the nested object like this:
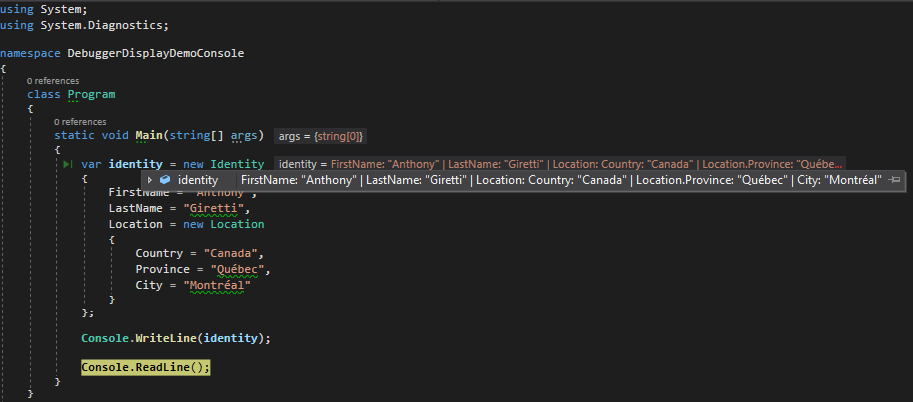
Easy isn’t it?
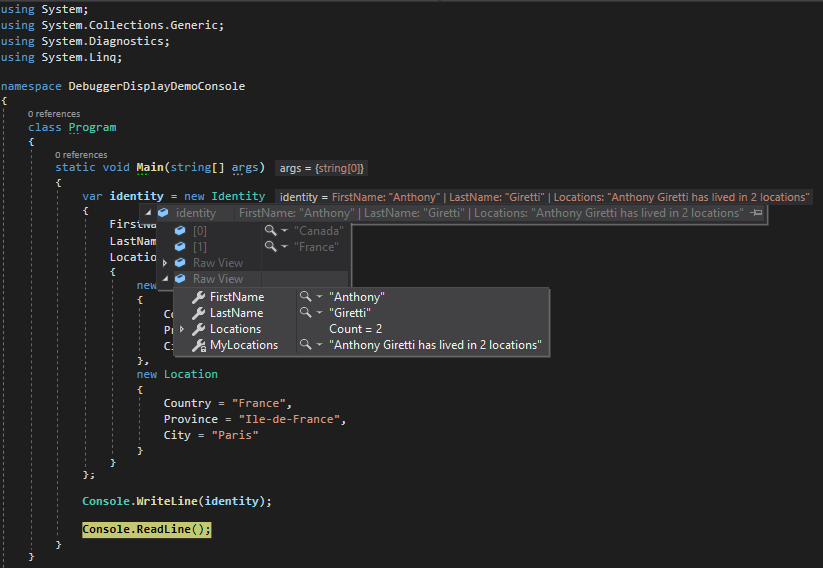
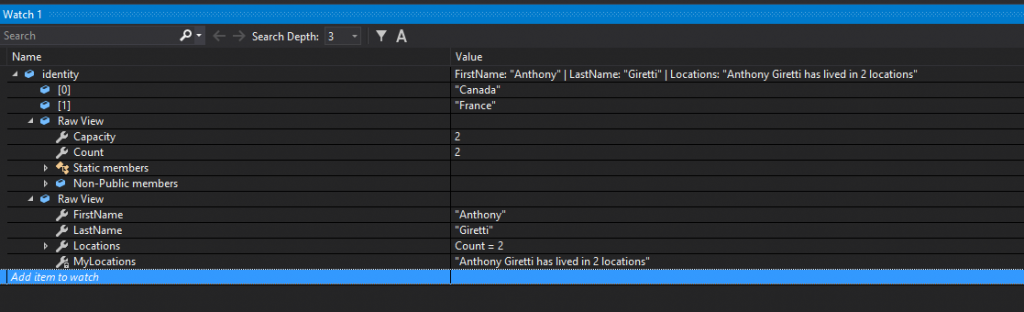
In some cases, with collections, you may want to count quickly and easily how many items an object has in its collection properties, example with a custom property that computes it and display the result in the debugger:
private string MyLocations
Practical isn’t it? 🙂
DebuggerTypeProxy attribute usage
Another interesting attribute here, with DebuggerTypeProxy you can create a complete new browsable variable context and it can work on a same object with DebuggerDisplay at the same time.
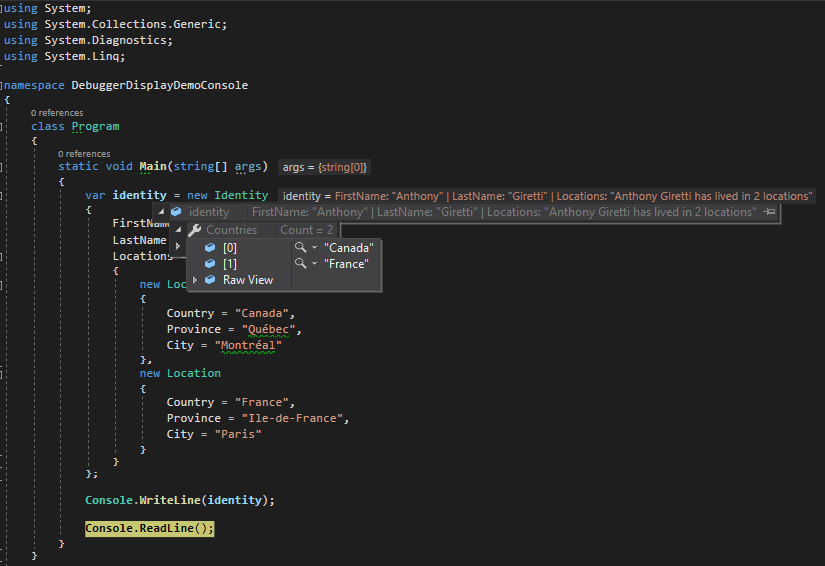
You’ll need to create a browsable property with DebuggerBrowsable attribute in a separate class, example with a debugging context that shows only coutries name:
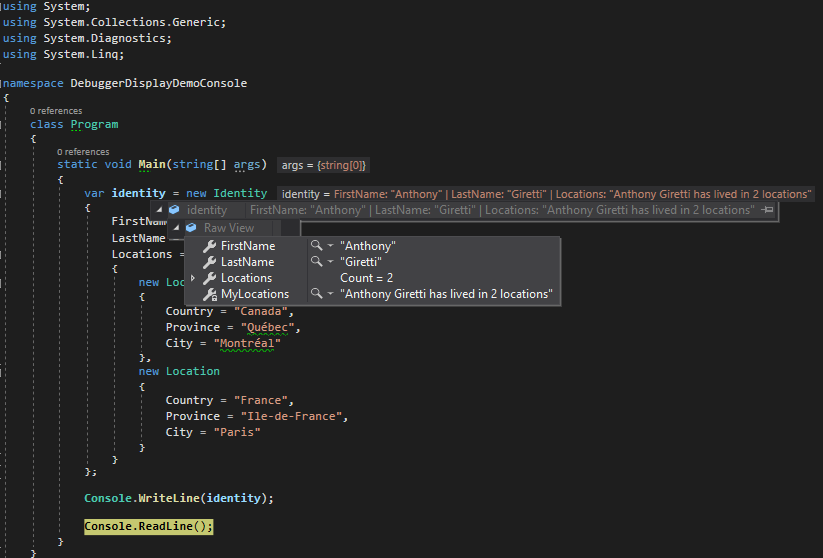
The DebuggerBrowsable attribute has in parameter DebuggerBrowsableState.RootHidden value, it means original “Identity” object that is the root object is not shown we directly access to the custom “Countries” property. If you want to see the original object you have to browse the second debugging context (the default browsable debugging context)
The DebuggerBrowsableState.Collapsed value does directly show the “Countries” property but collapsed, you’ll need to browse the property to see all countries, the default browsable debugging context is also accessible here:
The third possible value (DebuggerBrowsableState.Never) does entirely ignore the custom browsable debugging context:
Example with Watch window:
Conclusion
I discovered this feature very recently and I really enjoy it,it really helps me to debug my code efficnetly and focus on what I really want to check easily. Hpe you will enjoy this feature too 🙂