Using Google Charts in Angular 4 project, part 1
Introducing Google Charts
Google Charts is an HTML5/SVG thats provides many kind of charts.
The most common way to use Google Charts is with simple JavaScript that you embed in your web page. You load some Google Chart libraries, list the data to be charted, select options to customize your chart, and finally create a chart object with an id that you choose. Then, later in the web page, you create a with that id to display the Google Chart.
All chart types are populated with data using the DataTable class, making it easy to switch between chart types as you experiment to find the ideal appearance. The DataTable provides methods for sorting, modifying, and filtering data, and can be populated directly from your web page, a database.
In this article we will use Pie Chart (Donut Chart exactly) as sample.
Let’s get started with Google’s documentation :
<html>
  <head>
    <script type="text/javascript" src="https://www.gstatic.com/charts/loader.js"></script>
  </head>
  <body>
     <script type="text/javascript">
        google.charts.load("current", {packages:["corechart"]});
        function drawChart() {
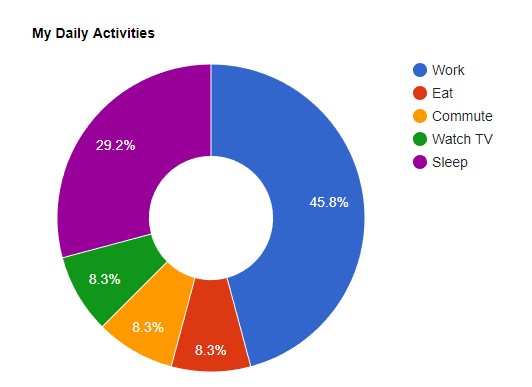
           var data = google.visualization.arrayToDataTable([['Task', 'Hours per Day'], ['Work', 11], ['Eat', 2], ['Commute',  2], ['Watch TV', 2], ['Sleep', 7] ]);
           var options = { title: 'My Daily Activities', pieHole: 0.4 };
           var chart = new google.visualization.PieChart(document.getElementById('donutchart'));
           chart.draw(data, options);
         }
         google.charts.setOnLoadCallback(drawChart);
       </script>
       <div id="donutchart" style="width: 900px; height: 500px;"></div>
  </body>
</html>
Here is the display result (in picture) :
Sexy isn’t it ? 🙂
How does it work ?
Step 1 :
Add the library js file within <head> tag of your page :
<script type="text/javascript" src="https://www.gstatic.com/charts/loader.js"></script>
Step 2 :
Load the library :
google.charts.load("current", {packages:["corechart"]});
Step 3 :
Write the proper callback to create the chart, this callback, must contain data, options to parameterize your chart, the proper method to display the type of chart you want to draw and then execute the draw method. Don’t forget to set the right id of the div you want to fill with the chart.
function drawChart() {
   var data = google.visualization.arrayToDataTable([['Task', 'Hours per Day'], ['Work', 11], ['Eat', 2], ['Commute',  2], ['Watch TV', 2], ['Sleep', 7] ]);
   var options = { title: 'My Daily Activities', pieHole: 0.4 };
   var chart = new google.visualization.PieChart(document.getElementById('donutchart'));
   chart.draw(data, options);
}
Important : It’s mandatory to use a callback, because object google.visualization is not set by the framework yet, it’s set during the page load.
Step 4 :
Setup the Google Chart call back named setOnLoadCallback like this :
google.charts.setOnLoadCallback(drawChart);
Step 6 :
Add a div container to be filled by the chart :
<div id="donutchart" style="width: 900px; height: 500px;"></div>
Then…..
I just showed you how to use Google Charts in classical web page in HTML / Javascript, now let’s go the next article to see :
1- How we can make it work in an Angular 4 project,
2- How we can abstract Google Charts from it if we want to change chart Library
3- How can make this kind of charts reusable by using Angular 4 components.
