Building real time charts with Angular 5, Google Charts, SignalR Core, .NET Core 2, Entity Framework Core 2 and SqlTable dependency, part 3
We are done with the project setup and the back end implementation, now let’s focus the front end solution.
What does it look like ?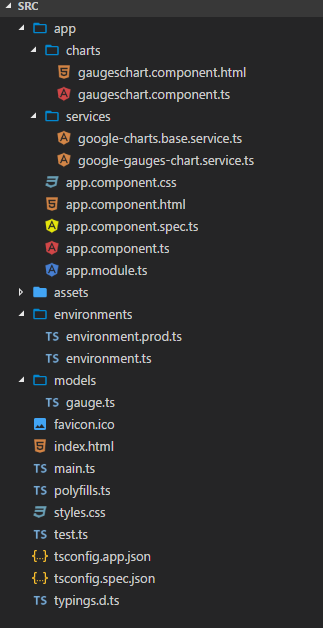
We have :
- A folder that contains the gauge chart component (gaugeschart.component.html and gaugeschart.component.ts)
- A folder that contains a gauge chart service and a Google Charts base service (google-gauges-chart.service.ts and google-charts.base.service.ts)
- A folder that contains environments files
- A folder that contains a strongly typed model for the gauge chart (gauge.ts)
- Finally at the root of src folder the defaults files components and module (app component files and app module file)
Implementation
Gauge.ts
export class GaugeModel {
    public id: number;
    public cpu: number;
    public memory: number;
    public network: number;
}
google-charts.base.service.ts and google-gauges-chart.service.ts
For more explanations about these files work, you can check a preivous article I wrote some times before : http://anthonygiretti.com/2017/10/12/using-google-charts-in-angular-4-project-part-2/
declare var google: any;

export class GoogleChartsBaseService {
  constructor() {
    google.charts.load('current', {'packages':['corechart','gauge']});
  }

  protected buildChart(data: any[], chartFunc: any, options: any) : void {
    var func = (chartFunc, options) => {
      var datatable = google.visualization.arrayToDataTable(data);
      chartFunc().draw(datatable, options);
    };
    var callback = () => func(chartFunc, options);
    google.charts.setOnLoadCallback(callback);
  }

}
import { GoogleChartsBaseService } from './google-charts.base.service';
import { Injectable } from '@angular/core';

declare var google: any;

@Injectable()
export class GoogleGaugesChartService extends GoogleChartsBaseService {

  constructor() { super(); }

  public BuildGaugesChart(elementId: String, data: any[], config: any) : void {
    var chartFunc = () => { return new google.visualization.Gauge(document.getElementById(elementId)); };
    this.buildChart(data, chartFunc, config);
  }
}
Gauge chart component
As you can see, the component is decorelated from Google Charts because I inject within a Google Gauge chart service, it can be easily replaced by another Javascript library such as canvas.js
import { Component, Input, OnInit } from '@angular/core';

import { GoogleGaugesChartService } from '../services/google-gauges-chart.service';
import { OnChanges } from '@angular/core/src/metadata/lifecycle_hooks';

declare var google: any;


@Component({
  selector: 'gauges-chart',
  templateUrl: './gaugeschart.component.html'
})
export class GaugesChartComponent implements OnInit, OnChanges {

    @Input() data: any[];
    @Input() config: any;
    @Input() elementId: String;

    constructor(private _gaugesChartService: GoogleGaugesChartService) {}

    /* Only chart data !!!!!!! */
    ngOnChanges(changes) {
        if (changes.data != undefined) {
            this.data = changes.data.currentValue;
            this._gaugesChartService.BuildGaugesChart(this.elementId, this.data, this.config);
        }
    }

    ngOnInit(): void {
        this._gaugesChartService.BuildGaugesChart(this.elementId, this.data, this.config);
    }
}
I used ngOnInit for the component initialization with its first binding to data, then we need to “listen” any moditication of data that are broadcasted with the specific event ngOnChanges and we ensure it’s data that are modified if (changes.data != undefined)
Component Html :
<div id="{{elementId}}" style="width: 400px; height: 120px;"></div>
App component
This is most insteresting part, we will see hoz the client side library for SignalR works
import { AfterContentInit, AfterViewInit, Component, OnInit } from '@angular/core';

import { environment as Environment } from '../environments/environment';
import { GaugeModel } from '../models/gauge';
import { HubConnection } from '@aspnet/signalr-client';

declare var google: any;

@Component({
  selector: 'app-root',
  templateUrl: './app.component.html',
  styleUrls: ['./app.component.css']
})
export class AppComponent implements OnInit {

  private _hubConnection: HubConnection;

  public data:any[] = [
    ['Label', 'Value'],
    ['Memory', 0],
    ['CPU', 0],
    ['Network', 0]
  ];
  public elementId:String = "Gauge1";
  public config:any = {
    width: 400, height: 120,
    redFrom: 90, redTo: 100,
    yellowFrom:75, yellowTo: 90,
    minorTicks: 5
  };


  constructor() {
  }

  public ngOnInit() {

    this._hubConnection = new HubConnection(Environment.hubUrl);

    this._hubConnection
      .start()
      .then(() => this._hubConnection.invoke('GetGaugesData').catch(err => console.error(err)))
      .catch(err => console.log('Error while establishing connection :('));

    var that = this;
    this._hubConnection.on('GetGaugesData', (data: GaugeModel) => {
      this.data = [
        ['Label', 'Value'],
        ['Memory', data.memory],
        ['CPU', data.cpu],
        ['Network', data.network]
      ];
    });

  }

}
Firstly, we need to isntantiate a HubConnection, like this : this._hubConnection = new HubConnection(Environment.hubUrl); it takes in parameter the Hub Url defined in environment.ts :
export const environment = {
production:false,
hubUrl:"http://localhost:33383/gauges"
};
Then we open the connection and define a callback when it succeeds or handle error when it occur :
this._hubConnection
.start()
.then(() => this._hubConnection.invoke('GetGaugesData').catch(err => console.error(err)))
.catch(err => console.log('Error while establishing connection :('));
When it succeed we invoke the method that populate initially our chart :
this._hubConnection.invoke('GetGaugesData')
Once we are done with the inialization, we subscribe to any change and modify data :
this._hubConnection.on('GetGaugesData', (data: GaugeModel) => {
      this.data = [
        ['Label', 'Value'],
        ['Memory', data.memory],
        ['CPU', data.cpu],
        ['Network', data.network]
      ];
    });
Component Html :
<h2>Real-Time Gaugeschart by Google with SignalR Core and EntityFramework Core 2 / SQLTableDependency</h2>

<div class="divTable">
   <divclass="divTableBody">
      <divclass="divTableRow">
         <divclass="divTableCell"><gauges-chart [data]="data" [config]="config" [elementId]="elementId"></gauges-chart></div>
       </div>
   </div>
</div>
Component Css :
.divTable{
    display: table;
    width: 100%;
}

.divTableRow {
    display: table-row;
}

.divTableHeading {
    background-color: #EEE;
    display: table-header-group;
}

.divTableCell, .divTableHead {
    border: 1px solid #999999;
    display: table-cell;
    padding: 3px10px;
    text-align: center;
    margin: auto;
}

.divTableHeading {
    background-color: #EEE;
    display: table-header-group;
    font-weight: bold;
}

.divTableFoot {
    background-color: #EEE;
    display: table-footer-group;
    font-weight: bold;
}

.divTableBody {
    display: table-row-group;
}
Appmodule.ts :
import { AppComponent } from './app.component';
import { BrowserModule } from '@angular/platform-browser';
import { GaugesChartComponent } from './charts/gaugeschart.component';
import { GoogleChartsBaseService } from './services/google-charts.base.service';
import { GoogleGaugesChartService } from './services/google-gauges-chart.service';
import { NgModule } from '@angular/core';

@NgModule({
declarations: [
AppComponent,
GaugesChartComponent
],

imports: [
BrowserModule
],

providers: [GoogleChartsBaseService,GoogleGaugesChartService],
bootstrap: [AppComponent]
})

export class AppModule { }
Index.html
<!doctype html>
<html lang="en">
<head>
   <metacharset="utf-8">
   <title>Angular5SignalRCoreEFCore2GoogleCharts</title>
   <basehref="/">
   <script type="text/javascript"src="https://www.gstatic.com/charts/loader.js"></script>
   <metaname="viewport"content="width=device-width, initial-scale=1">
   <linkrel="icon"type="image/x-icon"href="favicon.ico">
</head>
<body>
    <app-root></app-root>
</body>
</html>
Dont forget to put Google Charts reference 🙂 (loader.js)
Tha ‘s the end did you enjoy it? 🙂
Try to play with data ! 😮